For the last two years, Breakthrough Energy has partnered with Evolved Energy Research (EER) to produce the Annual Decarbonization Perspective (ADP) for the United States. The ADP employs state-of-the-art modeling to explore a wide range of pathways for reaching net-zero greenhouse gas emissions in the U.S. by mid-century. The ADP scenarios are designed to reflect numerous societal, economic, and technological uncertainties and illuminate tradeoffs across different decarbonization strategies. The goal of the ADP is to help inform policy and investment choices that are effective in driving the transition to net zero while being flexible and robust in the face of unexpected developments. Read the full report covering eight scenarios for detailed findings on energy supplies, end-use electrification, hourly electricity supply and demand, infrastructure development, transmission and pipeline capacity, land use, system costs, public health benefits, the land carbon sink and non-CO2 greenhouse gases, and updates reflecting the latest developments in technology cost and capabilities. For the first time, accompanying online materials provide detailed input and output data at the state level. This Executive Summary highlights ten important new findings from this year’s ADP:
- Current federal policies, especially the Inflation Reduction Act (IRA) of 2022 and Bipartisan Infrastructure Law (BIL) of 2021, have kick-started the adoption of the new technologies required to decarbonize the energy system and will significantly reduce U.S. emissions in both the near and long-term.
- Clean energy tax credits significantly reduce the direct cost of decarbonization, potentially keeping household energy costs lower than would otherwise be expected through the next couple of decades.
- New clean electricity incentives enable an accelerated scale up of clean energy technologies, but without a longer-term strategy to support continued deployment at home and abroad, clean energy supply chains could face a boom-and-bust cycle.
- Many emerging clean technologies needed at scale in the 2030s and beyond will require proactive infrastructure planning to enable their widespread deployment.
- Numerous technologies, including advanced nuclear and carbon capture and storage, are only modest cost declines away from being competitive contributors to a net-zero energy system. Supporting a diverse set of technologies with policies that help to reduce their costs will provide valuable optionality as we navigate uncertain obstacles along the way to net zero.
- Once referred to as “hard-to-decarbonize sectors,” heavy industries have a growing number of potential abatement options to enable an affordable pathway to net zero.
- Emerging technology for converting ethanol to jet fuel presents new decarbonization options in heavy transport and economic opportunities for corn producers even as electrification of cars and light trucks reduces gasoline—and ethanol—demand.
- Reusing the sites of existing coal and gas plants by retrofitting them with nuclear, CCS, or other clean generation technologies is a valuable opportunity to repurpose existing infrastructure while providing new clean firm power to balance a high-renewables grid.
- Half a gigatonne of Direct Air Capture (DAC) capacity could be needed in the U.S. by 2050 to achieve net zero, underscoring the urgency and importance of investing in emerging carbon-management technologies.
- Energy parks–large-scale renewables projects with co-located fuel production and/or other energy intensive industrial processes—could unlock clean energy potential in the near term that may otherwise be limited by slow transmission expansion.
Current federal policies, especially the Inflation Reduction Act (IRA) of 2022 and Bipartisan Infrastructure Law (BIL) of 2021, have kick-started the adoption of the new technologies required to decarbonize the energy system and will significantly reduce U.S. emissions in both the near and long-term.
Recently enacted federal policies are expected to reduce annual emissions by about 1 Gt by 2030, representing a significant down payment toward net zero. In Figure 1, the blue bars represent the modeled sources of emission reductions in 2030 required to keep the U.S. on a straight-line trajectory to net zero by 2050. The thin grey bars represent the reductions attributable to IRA, which accounts for most or all of the needed reductions from two fundamental decarbonization measures: renewable power generation and transportation electrification. Current policies also contribute significantly to reductions related to alternative fuel production, the land sector, and fugitive emissions. However, to reach the net zero trajectory, additional policies and investment at the federal and state levels will be required in these areas, as well as addressing existing coal generation, biofuels, energy efficiency, and heavy industry.

Figure 1. Sources of reductions in U.S. CO2 emissions in 2030 in Current Policy and Central Net-Zero scenarios, relative to Baseline.
Clean energy tax credits significantly reduce the direct cost of decarbonization, potentially keeping household energy costs lower than would otherwise be expected through the next couple of decades.
The clean energy tax credits enacted by recent legislation result in net cost savings across the energy system each year, reaching $91B of annual net savings in 2050 (Figure 2, left-most chart). Government spending on the tax credits translates to lower energy costs for U.S. households and businesses, enabling them to make investments that reduce emissions. Further increasing ambition to achieve net zero is also made much cheaper for energy consumers, with gross energy system costs exceeding savings only after 2045, relative to a baseline trajectory. The $68B in 2050 net energy system costs in the Central scenario is down from $172B in a net zero pathway modeled without recent policy support, demonstrating the ability of the tax incentives to make clean energy investments cheaper.
New clean electricity incentives enable an accelerated scale up of clean energy technologies, but without a longer-term strategy to support continued deployment at home and abroad, clean energy supply chains could face a boom-and-bust cycle.
This effect is illustrated by Figure 3, which shows the modeled build rates for solar and onshore wind capacity to 2050. Both show a steep decline in annual build after IRA tax credits expire in 2035. Electrolysis capacity for hydrogen production follows a similar pattern. While new supply-side tax incentives will play a significant role in reducing the costs of clean energy projects through 2035, they alone will be insufficient to encourage a long-term sustained energy transition. A more comprehensive approach that drives market demand (such as clean electricity standards), as well as grid infrastructure, financing mechanisms, and policy stability, will be required to sustain clean energy scale up and avoid the boom-and-bust cycles that could weaken investor confidence and destabilize supply chains and jobs.
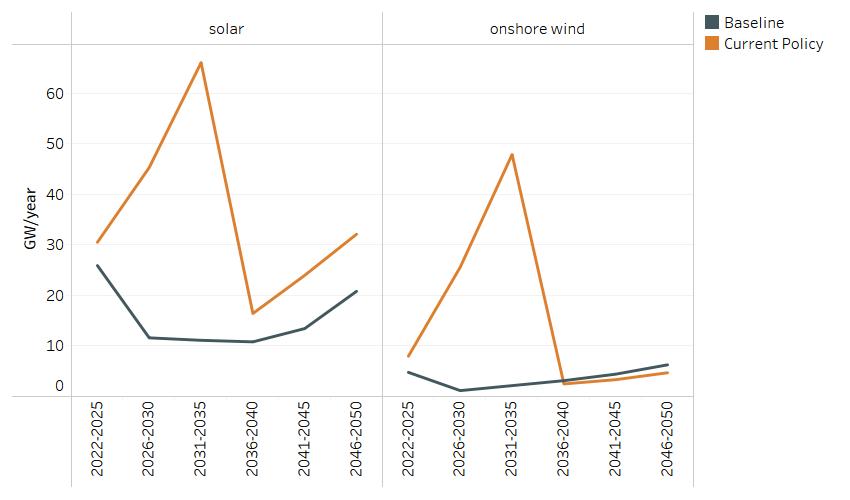
Figure 3. Annual installations of solar and onshore wind capacity in Baseline and Current Policy scenarios.
Many emerging clean technologies needed at scale in the 2030s and beyond will require proactive infrastructure planning to enable their widespread deployment.
Many key emerging decarbonization technologies face two kinds of challenges to widespread deployment. First, incentives and market transformation policies are needed to accelerate technology and adoption readiness and drive learning-by-doing cost reductions that come from higher-volume production. The IRA tax credits for hydrogen production, DAC and CCS are a significant step forward. Additional efforts such as the recently announced DOE hydrogen hubs can help further shorten the development timeline by supporting pilots and commercialization for multiple different hydrogen pathways while addressing deployment questions such as how to get products to users. But once emerging technologies mature and become more cost-competitive, there is a second challenge in scaling them up which requires the creation or expansion of enabling infrastructure, including transmission lines and pipelines for hydrogen and CO2 to name a few (Figure 4). To achieve net zero by 2050, the Central scenario requires more than doubling interregional electric transmission capacity, building 100 GW of hydrogen pipelines, and putting in place carbon dioxide pipelines capable of transporting nearly 50 Mt CO2 per year. Infrastructure planning, permitting, siting, and construction, along with supply chain and workforce development, can take years or even decades. Addressing infrastructure needs through efficient permitting, anticipatory planning by both industry and regulatory bodies, and other steps will be critical for sustaining momentum in the energy transition.

Figure 4. Interregional energy infrastructure capacity in 2050 for high-voltage transmission, hydrogen pipelines, and CO2 pipelines under Baseline, Current Policy and six net-zero scenarios. For comparison purposes a hydrogen pipeline with a capacity of 4 GW can move 1 Mt of hydrogen per year.
Numerous technologies, including advanced nuclear and carbon capture and storage, are only modest cost declines away from being competitive contributors to a net-zero energy system. Supporting a diverse set of technologies with policies that help to reduce their costs will provide valuable optionality as we navigate uncertain obstacles along the way to net zero.
Looking at any single pathway to net zero can obscure the importance of having a variety of clean energy technologies available to industries and households. Figure 5 shows the production capacity in 2050 for eight key low-carbon energy supply technologies across net-zero scenarios. The wide ranges demonstrate the considerable effect of scenario assumptions on net-zero technology mix (e.g., nuclear power and fossil generation with CCS are not allowed in the 100% Renewables scenario, but they become significant sources of power generation in the Low Land and Drop-In scenarios that explore what would happen if renewable energy development was significantly constrained). Across these scenarios, different combinations of technologies are used to navigate obstacles, keeping differences in cost between net-zero scenarios to no more than $200B per year, or roughly 0.6% of forecasted GDP. Continuing to provide robust RD&D funding for a diverse set of clean energy technologies can provide essential optionality in the face of future uncertainty.
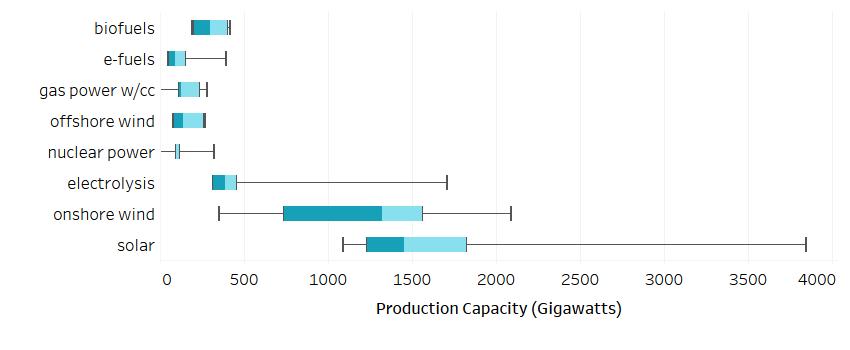
Figure 5. Production capacity of key low-carbon energy supply technologies across net-zero scenarios in 2050. Inner blue rectangle provides the interquartile range while the whiskers show the minimum and maximum across all scenarios.
Once referred to as “hard-to-decarbonize sectors,” heavy industries have a growing number of potential abatement options to enable an affordable pathway to net zero.
In the case of cement, one of the simplest, and potentially cheapest, abatement options is reducing the demand for clinker (see Low Demand panel of Figure 6), the most carbon-intensive component of cement. There are numerous methods for reducing clinker demand including by substituting alternative materials which lowers the clinker-to-cement ratio while still meeting the physical material requirements for cement or reducing the amount of cement in concrete. However, there are still barriers to adopting these demand reduction strategies, and for remaining clinker demand, technology advancements combined with enhanced 45Q tax credits for carbon capture and sequestration are creating new opportunities for emissions reductions in the production process itself. One innovative approach in the early commercialization stage physically separates process emissions from the high-temperature calcining process (converting limestone to lime). Isolating the calcining process enables production of a highly concentrated CO2 stream that can be more easily captured and sequestered. To heat the cement kiln, biomass is one option for replacing coal and natural gas (kiln electrification is also being explored but is not modeled here). While new tax credits make large-scale deployment of CCS at cement plants a possibility in the 2030s and 2040s (see Figure 6), further support may be needed to kickstart this shift, including government funding for demonstration and pilot projects, demand pull policies such as advance market commitments and contracts for difference that create bankable offtake, and investment in enabling infrastructure such as carbon dioxide pipelines and storage. Continued investment in other emerging cement technologies are also critical to eliminating emissions across the sector. These further steps will also be crucial for decarbonization of other heavy industries such as iron and steel—this year, the ADP identified a growing role for new steel plants that produce direct-reduced iron (DRI) fueled by clean hydrogen.
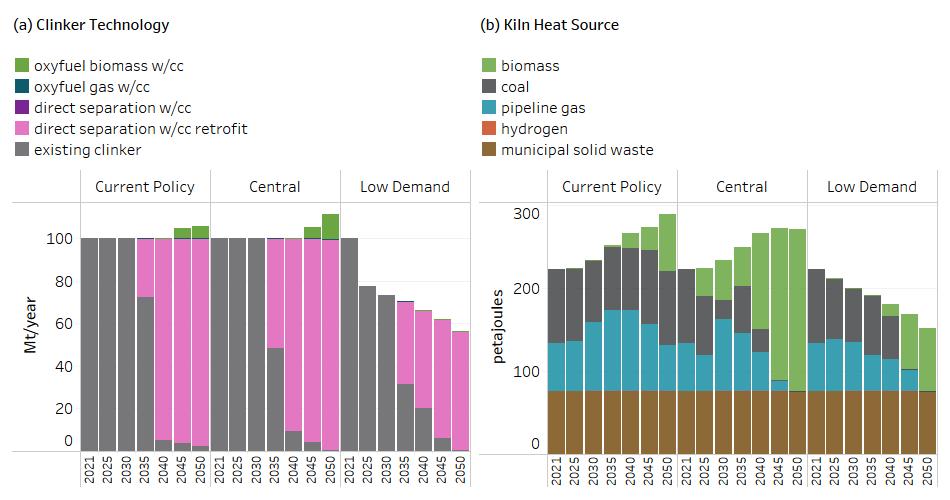
Figure 6. (a) Modeled technology options for decarbonizing the production of Portland cement clinker. (b) Energy supply options for providing high temperature heat to cement kilns.
Emerging technology for converting ethanol to jet fuel presents new decarbonization options in heavy transport and economic opportunities for corn producers even as electrification of cars and light trucks reduces gasoline—and ethanol—demand.
Many studies have projected a decline in U.S. ethanol production as vehicle electrification reduces sales of the gasoline blends that account for most U.S. ethanol demand. The prospect of declining ethanol demand leaves producers with little incentive to add CCS equipment to ethanol plants which could help capture and sequester the roughly 45 Mt of high-purity direct CO2 emissions they are responsible for today. However, new catalysts that enable efficient conversion of ethanol to jet fuel, as well as to diesel, are potential game-changers. This technology is consistently deployed across all model scenarios, and it is especially competitive when paired with carbon capture retrofits on existing ethanol plants which now receive enhanced support from the 45Q tax credit. The “alcohol-to-x” market has the potential to create new low-carbon fuel options while minimizing economic disruption for the ethanol industry. Policies that incentivize the transition of limited supplies of sustainable biomass to high-value, low-carbon applications such as jet fuel will be important for achieving net zero. A caveat is that cellulosic ethanol still has the potential to out-compete corn ethanol in a net-zero future, especially if other environmental factors such as water use are taken into account.
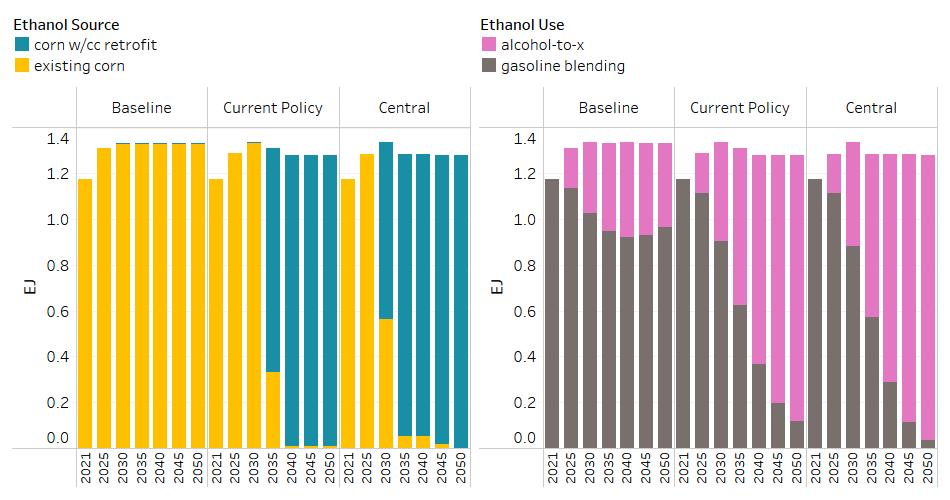
Figure 7. (L) Ethanol production technology (existing corn ethanol capacity vs. existing capacity with CCS retrofit) in the Central and Slow Consumer Uptake scenarios. (R) Ethanol application in the same cases.
Reusing the sites of existing coal and gas plants by retrofitting them with nuclear, CCS, or other clean generation technologies is a valuable opportunity to repurpose existing infrastructure while providing new clean firm power to balance a high-renewables grid.
Thermal generation, whether in the form of “clean firm” capacity such as nuclear, enhanced geothermal, and natural gas with CCS (post- or oxy-combustion), or peaking capacity that is seldom operated but available to run when needed (e.g., could be operated with biogas or hydrogen), is a key source of reliability in a decarbonized electricity system with high levels of intermittent renewable generation. When renewable development is constrained (e.g., by land-use or transmission limitations), clean firm capacity becomes an even more essential component of a decarbonized electricity generating portfolio. Retrofitting coal and gas power plants with nuclear and/or fossil with CCS is a potential option that may reduce siting and permitting barriers while leveraging brownfield sites with existing infrastructure such as transmission substations and—possibly—existing workforces. In the Drop-In scenario, the model chooses to add more firm capacity through retrofits than through greenfield development (Figure 8). Proactive planning by states and regions is needed to support investments in clean firm capacity and facilitate retrofit opportunities.

Figure 8. Dispatchable generating capacity in existing brownfield (L) and new greenfield (R) sites in the Drop-In scenario.
Half a gigatonne of Direct Air Capture (DAC) capacity could be needed in the U.S. by 2050 to achieve net zero, underscoring the urgency and importance of investing in emerging carbon-management technologies.
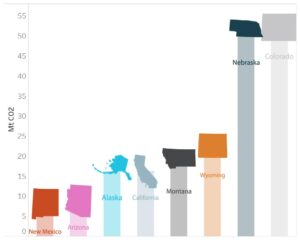
ADP 2023 addresses both the need for DAC—which ranges from zero in some scenarios to more than 500 Mt in others—and the question of the geographic suitability of different DAC technologies. The ADP 2023 further explored this question by factoring ambient climate into the competition between the two leading contenders, solid-sorbent and liquid solvent DAC—temperature and humidity are key determinants of DAC efficiency and resource requirements. Figure 9 presents an updated view on where DAC deployment could occur based on the Drop-in scenario. In this scenario, Colorado, Nebraska, and Wyoming have the most DAC deployment, owing to a variety of factors including favorable climatic conditions, access to high quality renewable resources, and proximity to geologic storage capacity. Ultimately, the optimal locations for DAC across the US will be determined by the complex interplay of those factors in addition to skilled workforce availability, supportive policy, and favorable regulatory environments. With DAC technologies still at an early stage and much left to learn, DOE’s RD&D programs for DAC, including DAC hubs and the recently announced carbon dioxide removal purchase pilot prize competition, are critical for continuing to help the technologies mature and to identify the best applications for deployment.
Energy parks–large-scale renewables projects with co-located fuel production and/or other energy intensive industrial processes—could unlock clean energy potential in the near term that may otherwise be limited by slow transmission expansion.
The challenge of quickly adding new clean generation to the grid is one of the biggest barriers to eliminating emissions from the U.S. power sector. This is particularly true across much of the Wind Belt which extends from Texas to the Dakotas, a region that has outstanding wind resources but is also further from urban centers where large electricity demand is located. Many of these wind resources are not developed in energy models because the costs (or long timelines) for transmission interconnection—delivering electricity to locations of demand—makes them uneconomic or infeasible. This challenge is illustrated by the roughly 2 TW of power plant capacity that was reported waiting in interconnection queues in 2022. However, there may be opportunities to develop remote wind and solar resources as “energy parks,” where on-site generation is used to produce fuels—and perhaps products such as direct-reduced iron ore or steel—that could then be transported via existing road, pipeline, rail, or barge routes to markets. The most promising candidate areas for energy parks are shown in Figure 10. In some regions, rules for developing new power projects may need to be modified so that energy parks which remain disconnected from the broader grid are not held back by bottlenecks in the interconnection process.
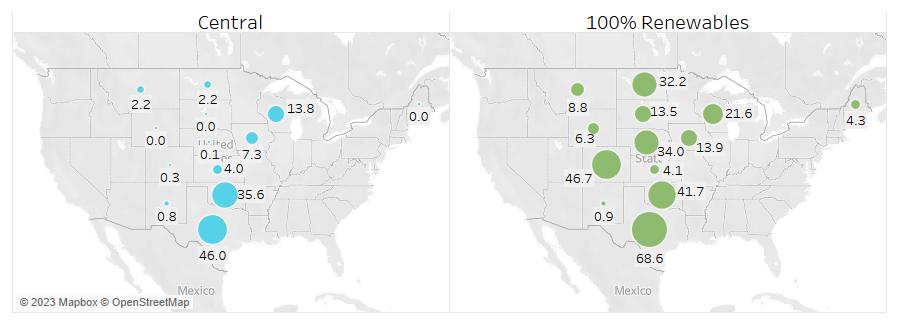
Figure 10. Locations with high potential for development as energy parks, based on renewable capacity factors and cost of transmission upgrades. Labels provide GW capacity for energy parks (wind & electrolysis). For scale, the energy parks in the Central case represent nearly 30% of total electrolysis capacity in 2050 in the U.S.
ADP 2023 Scenarios
- Baseline - This reference scenario is based on the DOE’s Annual Energy Outlook 2023 and assumes little electrification of demand-technologies and no IRA tax credits for energy supply technologies.
- Current Policy - This reference scenario is based on Princeton’s REPEAT mid scenario. It has the same demand for energy services as the net-zero cases but does not achieve deep decarbonization. It is used as a basis of comparison for the cost, emissions, infrastructure, land use and other attributes of the net-zero cases.
- Central - This is the least-cost pathway for achieving net-zero greenhouse gas emissions by 2050 in the U.S. It is economy-wide and includes energy and industrial CO2, non-CO2 GHGs, and the land CO2 sink. It is built using a high electrification demand-side case, and on the supply-side has the fewest constraints on technologies and resources available for decarbonization.
- Drop-in - This net-zero scenario is designed to minimize capital, labor, and institutional disruption. It delays the uptake of electrification technologies by twenty years, caps renewable build at historical rates, and disallows new long-distance transmission or pipelines.
- Low Demand - This net-zero scenario reduces the demand for energy services from that used in the other net-zero scenarios. It is designed to explore how high levels of conservation and energy efficiency, achieved through behavior, planning, policy, and other means, could reduce requirements for low-carbon infrastructure and land.
- Low Land - This net-zero scenario limits the use of land-intensive mitigation solutions, including bioenergy crops, wind and solar power generating plants, and transmission lines. It is designed to explore the effect of societal barriers to the siting of low-carbon energy infrastructure for environmental and other reasons.
- Slow Consumer Uptake - This net-zero scenario delays by twenty years the uptake of fuel-switching technologies including electric vehicles, heat pumps, fuel-cell vehicles, etc. It is designed to explore the effects of slow consumer adoption on energy system decarbonization, including the impacts on electricity and alternative fuel demand. In many cases, for example the adoption of electric vehicles, the uptake of electric technologies is slower than assumed in the current policy scenario.
- 100% Renewables - This net-zero scenario allows only wind, solar, biomass, and other forms of renewable energy by 2050. It is designed to explore the effects of eliminating fossil fuels and nuclear power altogether on energy infrastructure, electric power, and the production of alternative fuels and feedstocks.

